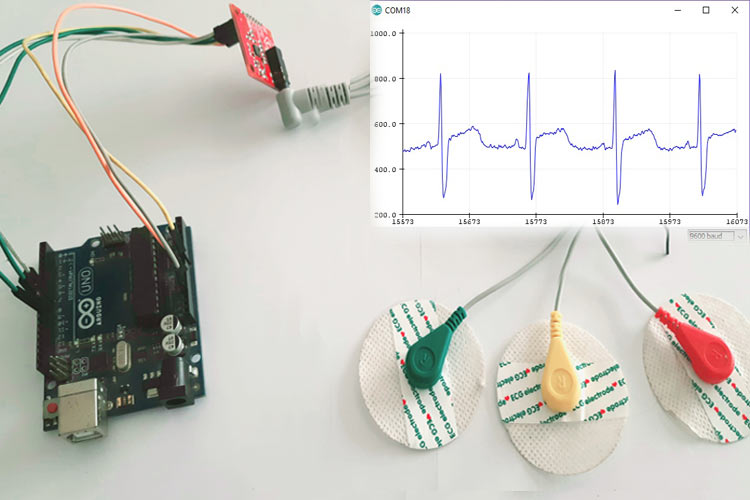
In this project, we will be exploring AD8232 ECG sensor working and will connect it with Arduino to run some analysis on the resulting waveform for medical diagnosis. We will also see different types of ECG sensors in the market, the lead placement for a 3 lead ECG system, and the various medical conditions that can be identified by analyzing an ECG. Apart from this, we will also understand the use of its shutdown mode and analyze the ECG signal to obtain heart rate and heart rate variability as an application. Do note that ECG and EKG are the same things so the terms can be used interchangeably. In some of our previous projects, we have also built an IoT based heart monitoring device, and a few other patient monitoring projects which you may also like to check.
So let's start with having a brief overview of ECG sensors.
How does an ECG Sensor Work?
ECG or Electro CardioGraphy is a method to measure some important parameters of a human heart. It outputs analog values that produce a particular signal that looks as shown below.
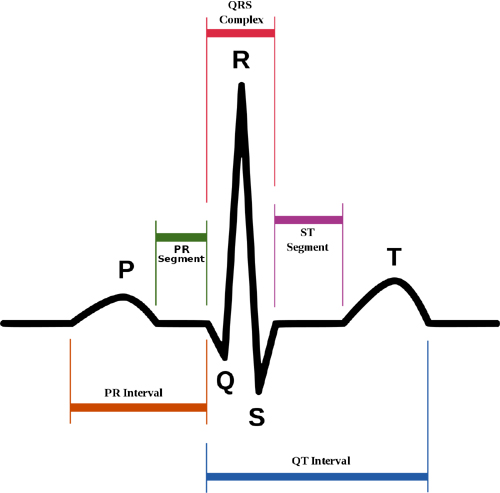
As visible, the signal has a few peaks and important features that are of biological importance. These are marked below.
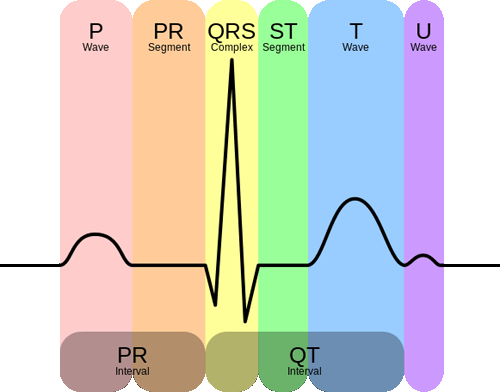
Each interval has an optimal value range, and deviation from that might be linked to a particular disease. Here are the main parts of an ECG signal.
- P wave - It is the trailing wave on the left of the QRS complex.
- QRS complex - It is an impulse generated by ventricular contraction.
- T wave - It is a leading wave right to the QRS complex.
- U wave - It is not always observed due to its low peak value.
There are many other features as well, but these are the main ones. Based on the shapes of the above features, their interval as well as the interval between them, we can diagnose a lot of cardiac diseases and irregularities. For example:
- Irregular heartbeat or absence of P-wave: Atrial Fibrillation
- Resting Heart Rate of more than 100: Tachyarrhythmia
- Tachyarrhythmia and delta wave: Wolf-Parkinson-White or WPW syndrome
- Sawtooth P wave: Atrial flutter
- Depression of ST-segment: it might indicate Ischemia
- Elevation of ST-segment: it might indicate myocardial Infarction
Hence, ECGs are extremely important for a cardiologist or any doctor for that matter.
Today, we will try to develop a simple system that will be able to measure ECG signal values and even measure the heartbeat of a person using them. First, we will focus on the hardware part as to how exactly is the ECG signal retrieved from the human body?
AD8232 ECG Sensor Electrodes Placement (3 Lead Sensor)
The AD8232 ECG sensor is the most commonly used and available ECG sensor that is affordable and can be used for hobby purposes. It is a 3 lead or single-channel ECG module. Other ECG sensor types available are 5 lead and 10 lead. Visit this link for more details about ECG positioning: https://litfl.com/ECG-lead-positioning/
For a 3-lead system, there are two placements that are used-
|
Electrode Name |
Electrode colour |
Location |
|
RA |
Red |
Right Arm |
|
LA |
Yellow |
Left Arm |
|
RL |
Green |
Right Leg |
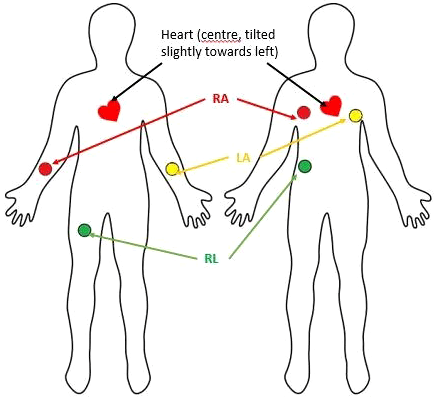
The left position is generally used for females and is the reason why the three electrodes are called RA, LA, and RL. However, this method of placing electrodes produces more noise and hence, it is preferred that the electrodes are placed as shown in the right position, especially for hospital patients.
Interfacing AD8232 ECG sensor with Arduino
The AD8232 from Analog Devices is a 3 lead ECG sensor, which has been converted into various breakouts and modules by Sparkfun and other 3rd party electronics manufacturers. All breakouts generally contain the following pins:
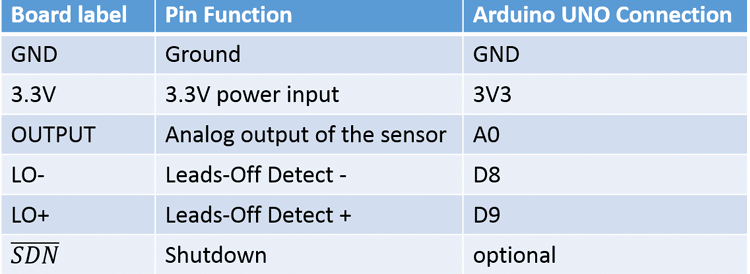
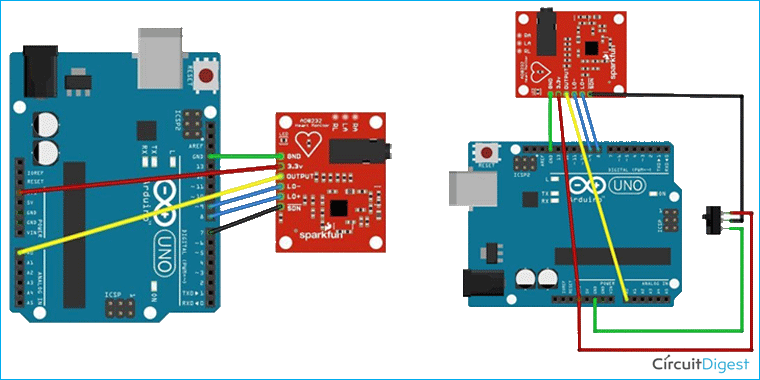
The shutdown pin is used to send the AD8232 sensor into standby mode, during which it only consumes a current of 200nA. Generally, that mode is not used because the ECG sensor data are to be taken continuously, but we can code in such a manner that the module enters standby mode when electrodes are removed or on a button press. A few possible schematics are shown below.
Most of the AD8232 Arduino Codes available online look as simple as this:
void setup() {
Serial.begin(9600);
pinMode(8, INPUT); // Setup for leads off detection LO +
pinMode(9, INPUT); // Setup for leads off detection LO -
}
void loop() {
if((digitalRead(8) == 1) || (digitalRead(9) == 1)){ //check if leads are removed
Serial.println("leads off!");
}
else{
Serial.println(analogRead(A0));
}
delay(1);
}
However, this code can only show you an ECG output similar to this-
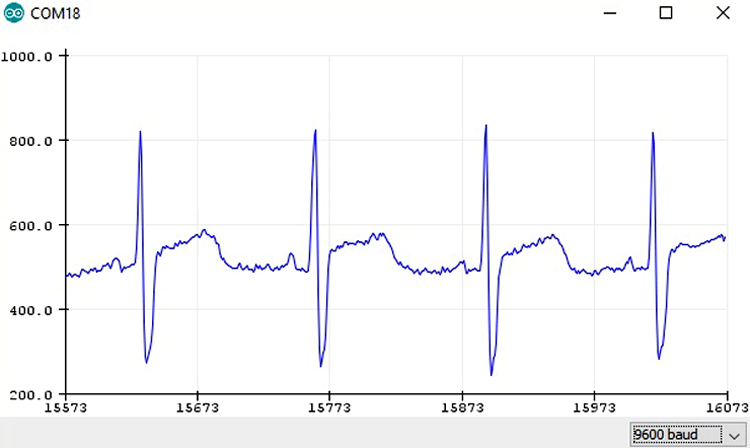
It will not analyze the ECG, check the presence of the P or T waves, nor will it measure your heartbeat. Hence, we will try to measure heartbeat and heart rate variability (HRV) using AD8232 ECG sensor. As discussed earlier, HR = No. of R peaks in 1 minute. However, this would mean that it would take 1 entire minute for a single HR value to appear. Hence, many people tend to measure the time interval between two consecutive R peaks and estimate HR using the following formula-


This might be very fast, but medically this is incorrect. Why? Because this equation assumes that each R-R interval throughout the entire 1 minute is the same. However, this is not the case. For an average healthy human, the time taken by 1 entire heartbeat is around 800-850 ms (65-75 beats per minute). This might change depending on whether the person is resting or working. Whatever the case might be, the heartbeat intervals do not vary much for the person. But for a person suffering from Atrial fibrillation or Arrhythmia varies significantly throughout the ECG, despite the average heartbeat appearing to be normal. The parameter to identify this is called Heart Rate Variability.
Calculating Heart Rate Variability (HRV) using AD8232 ECG Sensor:
Heart rate variability or HRV is calculated as follows-
HRV = HR/60 - RR interval
So, for calculating HRV, we need HR first. But 1 minute is too long. Hence, we use a window of 10 seconds to calculate both parameters.
HR = (RR peaks in 10 seconds)*6
HRV = HRV = HR/60 - RR interval

We can easily identify the R peak by thresholding. Then we can use interrupts or simple micros() to measure the interval between the two beats.
Working Demonstration of AD8232 ECG Sensor with Arduino
Place the electrodes as shown in the picture below. Since the image is a selfie, the placement of the ECG leads is mirror images of the actual placement. Connect the ECG sensor module to the Arduino board and upload the code which is given at the bottom of this page.
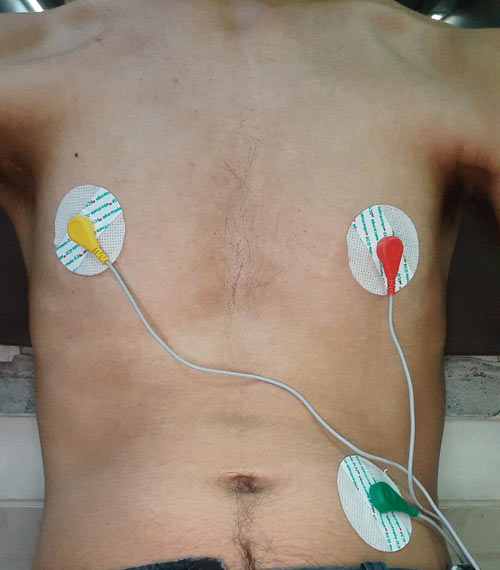
If everything works the way it is supposed, you can find the output on a serial plotter like something shown below.
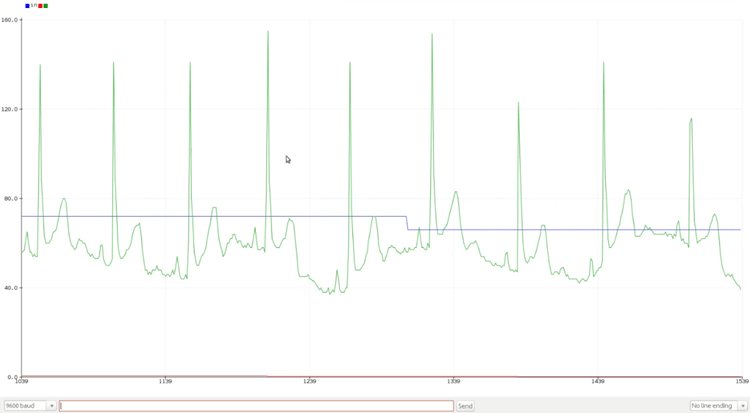
The green signal indicates a slightly modified ECG while the blue signal indicates the approx. heartbeat. The HRV values can be seen on the monitor when the plotter is not in use. Hrv is not visible much on the plotter because it will generally be around -1 to 1 milli secs for a normal human, while the ECG value and hr will be around 70. Hence, hrv is seen as a red line on the serial plotter. On the serial monitor, the values are displayed as follows:
hr, hrv, ECG_value
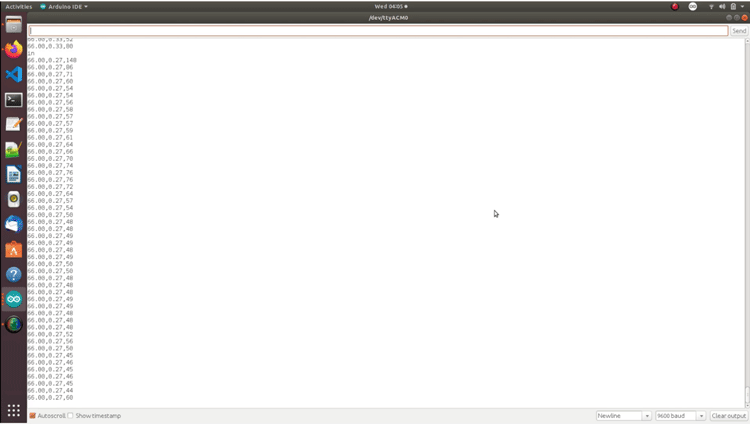
The default threshold is 100, but please set it as per your own sensor. The code is pretty simple and intuitive and just implements simple timers to measure the ECG values and RR intervals to calculate the hr and HRV variables according to the formula explained earlier.
Hope you enjoyed building this project and learned something useful. You can also check out the video below which demonstrated the working of this project. If you have any questions, leave them in the comment section below or you can also use our electronics forum to post your technical quires.
/*
* VARIABLES
* count: variable to hold count of rr peaks detected in 10 seconds
* flag: variable that prevents multiple rr peak detections in a single heatbeat
* hr: HeartRate (initialised to 72)
* hrv: Heart Rate variability (takes 10-15 seconds to stabilise)
* instance1: instance when heart beat first time
* interval: interval between second beat and first beat
* timer: variable to hold the time after which hr is calculated
* value: raw sensor value of output pin
*/
long instance1=0, timer;
double hrv =0, hr = 72, interval = 0;
int value = 0, count = 0;
bool flag = 0;
#define shutdown_pin 10
#define threshold 100 // to identify R peak
#define timer_value 10000 // 10 seconds timer to calculate hr
void setup() {
Serial.begin(9600);
pinMode(8, INPUT); // Setup for leads off detection LO +
pinMode(9, INPUT); // Setup for leads off detection LO -
}
void loop() {
if((digitalRead(8) == 1)||(digitalRead(9) == 1)){
Serial.println("leads off!");
digitalWrite(shutdown_pin, LOW); //standby mode
instance1 = micros();
timer = millis();
}
else {
digitalWrite(shutdown_pin, HIGH); //normal mode
value = analogRead(A0);
value = map(value, 250, 400, 0, 100); //to flatten the ecg values a bit
if((value > threshold) && (!flag)) {
count++;
Serial.println("in");
flag = 1;
interval = micros() - instance1; //RR interval
instance1 = micros();
}
else if((value < threshold)) {
flag = 0;
}
if ((millis() - timer) > 10000) {
hr = count*6;
timer = millis();
count = 0;
}
hrv = hr/60 - interval/1000000;
Serial.print(hr);
Serial.print(",");
Serial.print(hrv);
Serial.print(",");
Serial.println(value);
delay(1);
}
}
Comments
Hello, thanks for sharing…
Hello, thanks for sharing your project, but i have some questions.
1- Where's did come the number 6 at the "hb = count*6"?
2- Why the hb starts in 72?
Thanks.



hello and thanks for the excellent explanation on the use of this card, I have a doubt though, why the card has 3 electrodes and I get only one derivation as a result? with the use of 3 electrodes shouldn't I get 3 graphs of 3 distinct derivations? LA-RA first derivation, RA-RL second derivation and LA-RL third derivation? If not, can I connect only 2 electrodes to obtain an exact derivation (first, second or third derivation is the same)? because in this case I could buy 3 cards and get 3 derivations, one for each card. Sorry for the long question and thanks again :)