graphics
|
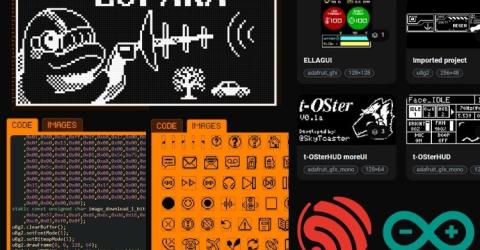
Lopaka App: A Free Tool for Streamlining Graphics and UI Design for Arduino Projects Lopaka is a robust web-based tool designed to simplify graphics design for embedded systems. Originally gaining attention through a Reddit post,… |

|
Pescado Engine: A Custom 3D Graphics Solution for ESP32-S3 Game developer Alex Fish has unveiled a new 3D graphics engine called Pescado, specifically tailored for the Espressif… |

|
Renesas Introduces Advanced RA8D1 MCU Series Powered by Arm Cortex-M85 for Enhanced AI and Graphic Display Solutions. Renesas Electronics introduced their new RA8D1 microcontroller family. The RA8D1 series is the Renesas’s first MCU based on the Arm COrtex-M85… |

|
TouchGFX Advanced and Free of Charge Graphical Framework Optimized for STM32 Microcontrollers STMicroelectronics has released version 4.20 of its TouchGFX user-interface design software which is an… |
|
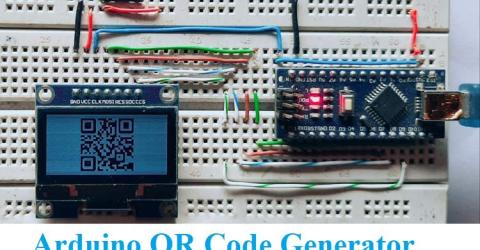
Generate a QR code using Arduino and display it on SSD1306 OLED The "Quick Response" code or abbreviated as QR code has become an essential part of our digital lives, chances are that you're… |
|
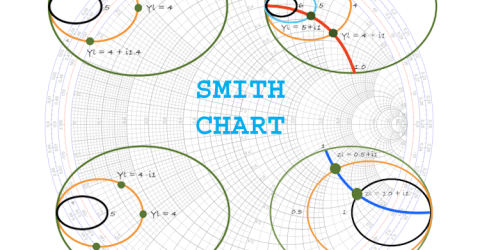
Basics of Smith Charts and how to use it for Impedance Matching RF Engineering is one of the most interesting and challenging parts of Electrical Engineering due to its high computational… |
|
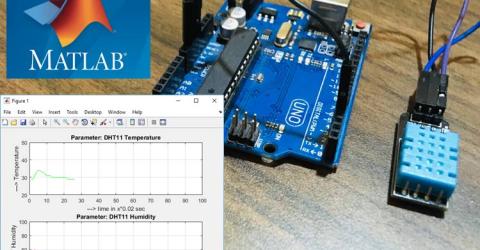
MATLAB Data Logging, Analysis and Visualization: Plotting DHT11 Sensor readings on MATLAB Graphical representation is always helpful to visualize the data and it becomes very easy to find trends and patterns by… |
|
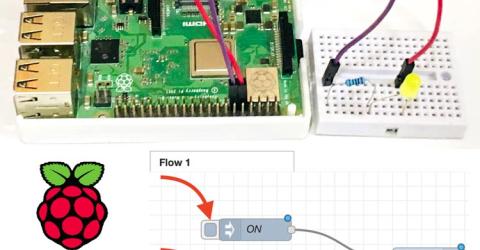
How to install Node-RED on Raspberry Pi to Control an LED Ever wondered if there was a way to make simple prototypes of IoT solutions without having to spend days writing codes or to… |
|
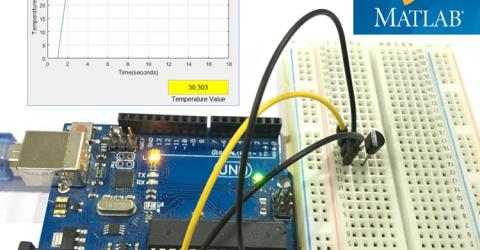
How to Plot Real Time Temperature Graph using MATLAB Graphs are always helpful to visualize the data and it becomes very easy to find trends and patterns by looking at them. There… |

|
Interfacing Arduino with VPython - Creating Graphics In our previous tutorial we learnt how to install python on our windows machine and how to interface Arduino with python using… |

